Image Details
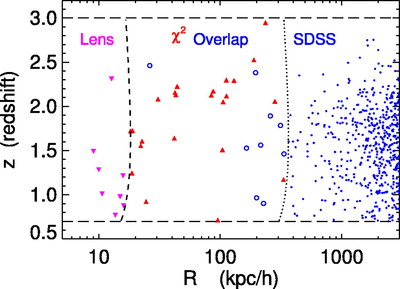
Caption: Fig. 8.
Range of redshifts and proper transverse separations probed by the binary quasars in our clustering subsample. The blue dots show binary quasars identified in the SDSS spectroscopic sample (﹩\theta > 60^{\prime \prime }﹩). The dotted line indicates the transverse separation corresponding to ﹩\theta =60^{\prime \prime }﹩. The open blue circles indicate pairs from the overlapping plates. These pairs are required to also meet the χ2 selection criteria (eq. [4]). The magenta and red triangles show members of the lens and χ2 samples, respectively. The short‐dashed curve indicates the transverse separation corresponding to ﹩\theta =3^{\prime \prime }﹩, below which binaries are found with our lens algorithm. The horizontal long‐dashed curves at ﹩z=0.7﹩ and 3.0 indicate the redshift limits of the clustering subsample.
Other Images in This Article
Show More
Copyright and Terms & Conditions
© 2006. The American Astronomical Society. All rights reserved. Printed in U.S.A.