Image Details
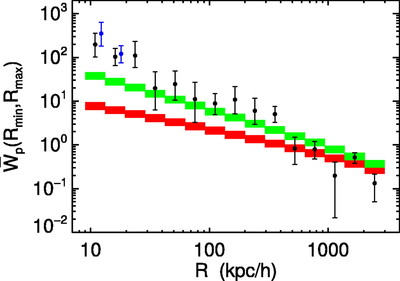
Caption: Fig. 11.
Small‐scale quasar clustering in proper coordinates. Top: Comparison of the projected correlation function ﹩\overline{W}_{p}( R_{\mathrm{min}\,},\ R_{\mathrm{max}\,},\ z) ﹩ (see eq. [11]) measured from our clustering sample with the prediction of the large‐scale measurement of PMN04, extrapolated as a power law down to the scales probed by our binaries. Error bars are 1 σ Poisson counting errors. The blue circles show the measurement of the projected correlation function if we use the lower limit (optimistic) for the selection function of our lens algorithm (Fig. 10, blue histogram) to predict the number of quasar‐random pairs, rather than the upper limit, which is shown by the black circles. The blue circles are offset slightly to the right for the sake of illustration. Red and green rectangles indicate the predictions based on the large‐scale measurements of PMN04 for ﹩\gamma =1.53﹩ and 1.8, respectively, where the heights of the rectangles indicate the range of predictions based on 1 σ errors in the correlation length measurements, and the widths indicate the bin used for each measurement. Bottom: Ratio of the projected correlation function to the (best‐fit ﹩\gamma =1.53﹩) prediction of PMN04.
Other Images in This Article
Show More
Copyright and Terms & Conditions
© 2006. The American Astronomical Society. All rights reserved. Printed in U.S.A.
Copyright ©
2026 Astronomy Image Explorer. All Rights Reserved.