Image Details
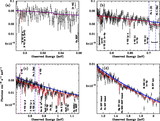
Caption: Fig. 7.
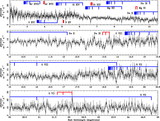
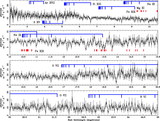
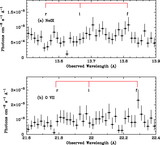
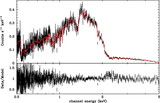
Velocity profiles from combined Chandra MEG and HEG spectra (except for O VIII Lyα [λ18.969], which is from MEG data only since it is outside the bandpass of the HEG). The profiles correspond to some of the strongest absorption features in the data (see Table 1). The absorption features are well described by the column densities from the best‐fitting XSTAR photoionization model (curves), which has ﹩\mathrm{log}\,\xi =2.52﹩ ergs cm s−1 and ﹩N_{\mathrm{H}\,}=5.37\times 10^{21}﹩ cm−2 (see § 5). The model profiles were calculated using the model EW and a Gaussian with ﹩\sigma =b/ \sqrt{2}﹩, for ﹩b=200﹩ km s−1, inferred from a curve‐of‐growth analysis (see § 5.5 and Fig. 13). The profiles were given a uniform blueshift of −140 km s−1, corresponding to the weighted mean of the velocity shifts in Table 1, excluding the Fe XX absorption feature, which is skewed because of likely blending (see § 5.5). A velocity of zero corresponds to the systemic velocity for NGC 4593 (assuming ﹩z=0.0083﹩). A negative velocity here indicates a blueshift relative to systemic. The centroids of the absorption features lie between systemic and about −350 km s−1 (see Table 1), but all the profiles extend redward to the systemic velocity and slightly beyond. FWHM velocity widths from Gaussian fitting are given in Table 1 and can be compared with the FWHM MEG velocity resolution of 360, 565, 810, and 1105 km s−1 for O VIII, Lyα (λ18.969), Ne X Lyα (λ12.134), Mg XII Lyα (λ8.421), and Si XIV Lyα (λ6.182), respectively, at observed wavelengths.
Other Images in This Article
Show More
Copyright and Terms & Conditions
© 2003. The American Astronomical Society. All rights reserved. Printed in U.S.A.