Image Details
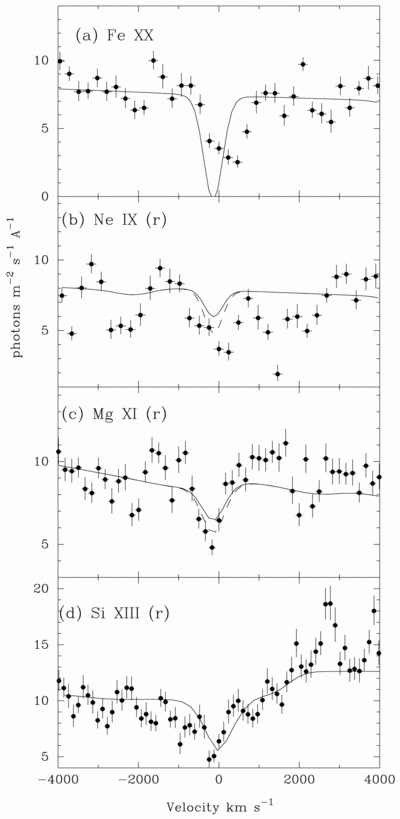
Caption: Fig. 8.
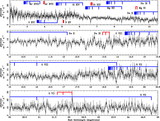
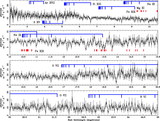
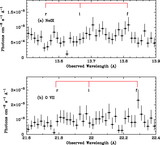
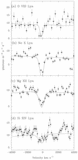
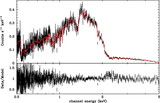
Same as Fig. 7, for four more velocity spectra from combined Chandra MEG and HEG data. Solid lines correspond to absorption profiles calculated from the best‐fitting photoionization model as in Fig. 7. Dashed lines correspond to absorption profiles calculated using the upper limits (at 99% confidence) of the column density from the best‐fitting photoionization model. Clearly the best‐fit photoionization model underpredicts some of the features on which the spectra are centered (see labels), but the upper limits on the ionic column densities are more consistent with the profiles for Ne IX (r) 1s2–1s2p (λ13.447) and Mg XI (r) 1s2–1s2p (λ9.169) in particular. The profiles were given a uniform blueshift of −140 km s−1, which corresponds to the weighted mean of the velocity offset of the strongest absorption features (see § 5.5). FWHM velocities from Gaussian fitting are given in Table 1 and can be compared with the FWHM MEG velocity resolution of 535, 510, 745, and 1030 km s−1 for Fe XX (λ12.817), Ne IX 1s2–1s2p (λ13.447), Mg XI 1s2–1s2p (λ9.169), and Si XIII 1s2–1s2p (λ6.648), respectively, at observed wavelengths. Blending with Fe transitions is particularly likely to be associated with the Fe XX (λ12.817) and Ne IX 1s2–1s2p (λ13.447) transitions.
Other Images in This Article
Show More
Copyright and Terms & Conditions
© 2003. The American Astronomical Society. All rights reserved. Printed in U.S.A.