Image Details
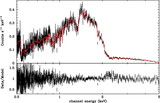
Caption: Fig. 3.
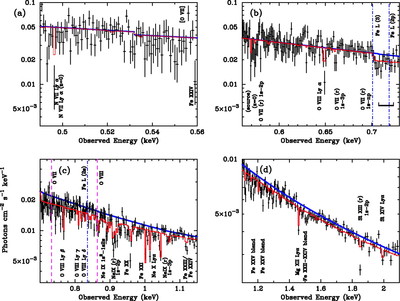
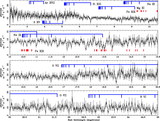
NGC 4593 MEG observed photon spectrum (binned at 0.08 Å) compared with the best‐fitting photoionized absorber model (red solid line). Also shown is the intrinsic continuum (blue solid line) modified by Galactic absorption (neither the data nor model has been corrected for Galactic absorption). The dashed lines show the expected positions of some bound‐free absorption edges. The model consists of an intrinsic continuum that is a broken power law (best‐fitting break energy at 1.07 keV), absorbed by photoionized gas with best‐fitting ionization parameter ﹩\mathrm{log}\,\xi =2.52﹩ ergs cm s−1 and column density ﹩5.37\times 10^{21}﹩ cm−2. Full details of the model calculations and fitting procedures and discussion of the details of the comparison between data and model can be found in § 5. The 0.7–1.1 keV region is very complex so simple two‐edge models fitted to older CCD data (of Seyfert 1 galaxies in general) could have been biased by this complexity. There is also an instrumental feature between ~0.85 and 0.9 keV (see Fig. 10), which may be partly responsible for the poor fit in this region.
Other Images in This Article
Show More
Copyright and Terms & Conditions
© 2003. The American Astronomical Society. All rights reserved. Printed in U.S.A.