Image Details
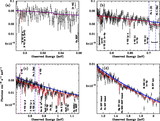
Caption: Fig. 13.
Curves of growth for various values of the velocity width, b. Plotted for each b‐value is the logarithm of line equivalent width (EW) per unit wavelength against the logarithm of the product of ionic column density (N), oscillator strength (f), and wavelength (λ). The plotted points are taken from the measured equivalent widths (converted to angstroms by using the values in Table 1) and predicted ionic column densities (from the best‐fitting XSTAR model described in § 5). These values are consistent with ﹩b=200﹩ km s−1 within errors.
Other Images in This Article
Show More
Copyright and Terms & Conditions
© 2003. The American Astronomical Society. All rights reserved. Printed in U.S.A.
Copyright ©
2025 Astronomy Image Explorer. All Rights Reserved.