Image Details
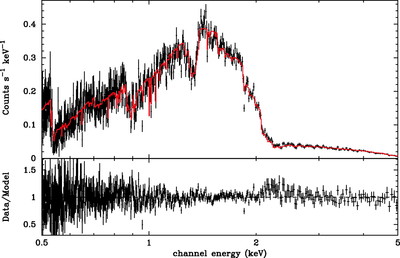
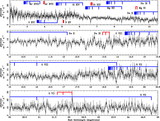
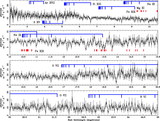
Caption: Fig. 10.
Comparison of MEG data (top; raw counts spectrum) binned at 0.16 Å with the best‐fitting XSTAR photoionization model (red curve; see § 5) and the ratio of data to model (bottom), showing a good overall fit to the data. In this representation the various instrumental edges and features can be seen, and in particular the poor fit around 2.0–2.5 keV can be seen to coincide with the large jump in the X‐ray telescope effective area.
Other Images in This Article
Show More
Copyright and Terms & Conditions
© 2003. The American Astronomical Society. All rights reserved. Printed in U.S.A.
Copyright ©
2025 Astronomy Image Explorer. All Rights Reserved.