Image Details
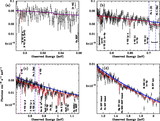
Caption: Fig. 9.
Observed and constructed baseline SED (solid curve) used for photoionization modeling of NGC 4593. Average radio and IR fluxes are from Ward et al. (1987). The optical and UV data are fluxes from noncontemporaneous observations in NED. The X‐ray portion is constructed from our Chandra HETGS and RXTE data. The hard X‐ray power law has ﹩\Gamma =1.794﹩ and has been extended to 500 keV. Given the significant variability in the UV/optical we have constructed upper and lower envelopes enclosing the data. The solid and dash‐dotted lines correspond to the upper (SEDa) and lower envelopes of optical‐UV data in NED, respectively. Note the prominent bump in the IR‐UV region of the spectrum. The dashed line (SEDb) corresponds to simply joining the IR flux at 0.33 eV and the X‐ray flux at 0.5 keV with a straight line in log‐log space and thus has no prominent bump in the IR‐UV region. See § 5.1 for full details of the construction and applications of the SEDs. The dotted curve is the "mean AGN" SED of Matthews & Ferland (1987), normalized to the same ionizing luminosity (i.e., in the range 1–1000 ryd) as that of the NGC 4593 baseline SED (SEDa).
Other Images in This Article
Show More
Copyright and Terms & Conditions
© 2003. The American Astronomical Society. All rights reserved. Printed in U.S.A.