

Image Details
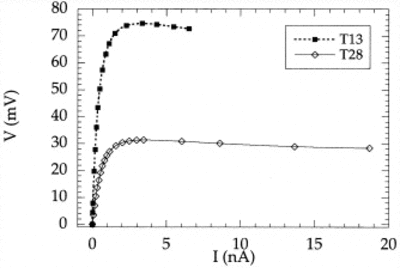
Caption: Fig. 8.
Load curves for two Hertz bolometers. The bolometer T13 is representative of the ones in the tops of the arrays with higher G (about 3 nW K−1), and T28 is representative of the ones in the bottoms of the arrays with lower G (about 1 nW K−1). The bolometers were exposed to a 300 K radiation load just outside the Dewar window.
Other Images in This Article
Copyright and Terms & Conditions
© 1998. The American Astronomical Society. All rights reserved. Printed in U.S.A.

Copyright ©
2026 Astronomy Image Explorer. All Rights Reserved.
