

Image Details
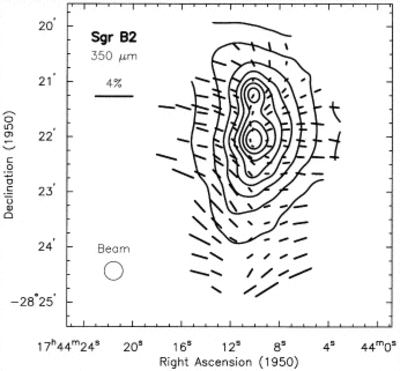
Caption: Fig. 7.
Polarization of Sgr B2 at 350 μm, measured with Hertz. The vectors show the orientation of the maximum electric field. If we assume polarization by emission, the implied magnetic field is perpendicular to the vectors. The vector length is proportional to the polarization. All of the vectors shown were detected with greater than 3 σ significance. The contours show the distribution of total flux measured simultaneously with Hertz. The contour levels are 0.2, 0.3, 0.4, 0.5, 0.6, 0.7, 0.8, and 0.9 times the peak flux of 3960 Jy in a 20﹩\arcsec﹩ beam at Sgr B2 Main (Goldsmith et al. 1990). The second peak approximately 50﹩\arcsec﹩ to the north of Main is Sgr B2 North.
Other Images in This Article
Copyright and Terms & Conditions
© 1998. The American Astronomical Society. All rights reserved. Printed in U.S.A.

