

Image Details
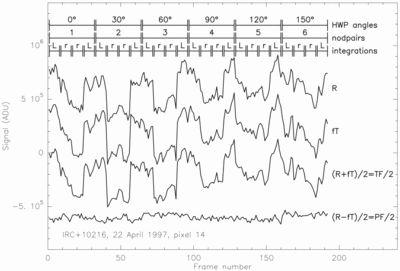
Caption: Fig. 2.
"Strip chart" record of the frames accumulated during a single file. The R and T detectors shown here (pixel 14) were centered on the source IRC+10216 (Fν = 30 Jy; Sandell 1994). Each point on a curve is one frame, the fundamental unit of stored data that is accumulated for two cycles of the chopping secondary (~0.6 s). The T frames have been multiplied by a normalization factor f to bring them to the same scale as the R frames. Correlated sky noise is evident in R and T as well as in their sum. The correlated noise is subtracted away by taking the difference (R − fT). The organization of the data collection is labeled at the top. Individual integrations in left or right beam and nodpairs are enumerated. The source flux is evident as a deflection in the R and T signals as the telescope is moved from left to right beam, most clearly observed in nodpair 2. Polarized flux from the source is not seen since it is weaker than the noise level. The frames were not collected continuously; time gaps occur during nodding and half‐wave plate rotation.
Other Images in This Article
Copyright and Terms & Conditions
© 1998. The American Astronomical Society. All rights reserved. Printed in U.S.A.

