

Image Details
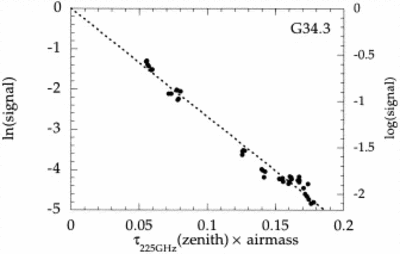
Caption: Fig. 5.
Extinction curve of G34.3 from observations in 1997 April. The signal, observed with a single pixel centered on the source, is plotted vs. the atmospheric optical depth at 225 GHz measured by the CSO radiometer. Each point corresponds to an average signal during a 5 minute file. The signal has been normalized to 1.0 at τ = 0. The linear fit shown has a slope of −26.9.
Other Images in This Article
Copyright and Terms & Conditions
© 1998. The American Astronomical Society. All rights reserved. Printed in U.S.A.

Copyright ©
2026 Astronomy Image Explorer. All Rights Reserved.
