

Image Details
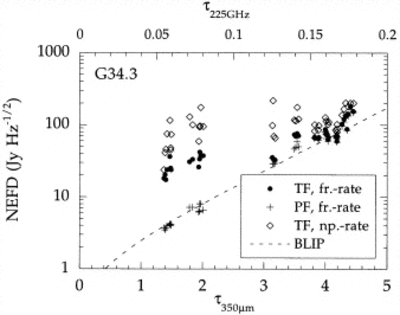
Caption: Fig. 6.
Sensitivity measurements on G34.3 from 1997 April. Each point represents the result of a several minute integration and shows the median noise across the array. The noise is flux calibrated vs. the signal measured in the detector centered on G34.3, assuming 1125 Jy for the source (Sandell 1994). The integration time includes the time spent off the source during chopping but does not include the time required to nod the telescope and rotate the half‐wave plate. Three methods are used to measure the noise (§ 4.1): frame‐rate statistics of the total flux TF, frame‐rate statistics of the polarized flux PF, and nodpair‐rate statistics of TF. The theoretical sky‐background–limited NEFD (§ 5.2.2) is shown with the dashed line. The chopper throw was 6﹩\arcmin﹩–8﹩\arcmin﹩.
Other Images in This Article
Copyright and Terms & Conditions
© 1998. The American Astronomical Society. All rights reserved. Printed in U.S.A.

