

Image Details
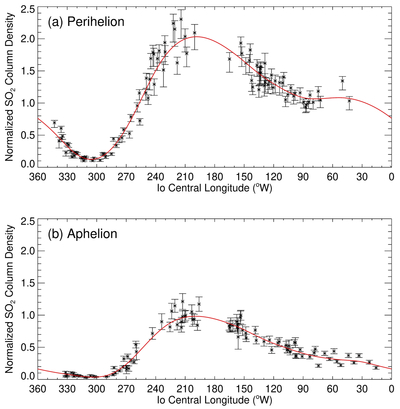
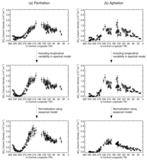
Caption: Figure 4.
The longitudinal distribution of the equatorial SO2 column abundances. The perihelion data cover dates with a heliocentric distance of less than 5.04 AU and are normalized to perihelion. The aphelion data cover dates with a heliocentric distance of greater than 5.04 AU and are normalized to aphelion. In each case, the red line shows a cubic spline fit to the data points.
Other Images in This Article
Copyright and Terms & Conditions
© 2026. The Author(s). Published by the American Astronomical Society.

Copyright ©
2026 Astronomy Image Explorer. All Rights Reserved.
