

Image Details
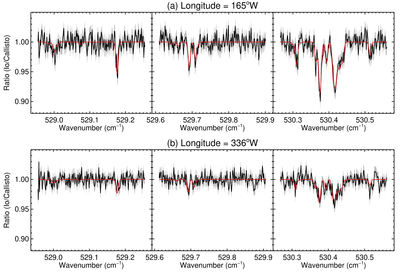
Caption: Figure 1.
Two reduced Io spectra, showing the difference in the SO2 absorption features between the anti-Jovian hemisphere (central longitude of 165∘W) and the sub-Jovian hemisphere (central longitude of 336∘W). The data were obtained on two consecutive nights (2023 July 25 for (a) and 2023 July 24 for (b)). The data are shown in black with the noise in gray. The spectra have each been divided by a Callisto spectrum, flattened and normalized. The corresponding best-fit model spectrum is shown in red.
Other Images in This Article
Copyright and Terms & Conditions
© 2026. The Author(s). Published by the American Astronomical Society.

Copyright ©
2026 Astronomy Image Explorer. All Rights Reserved.
