

Image Details
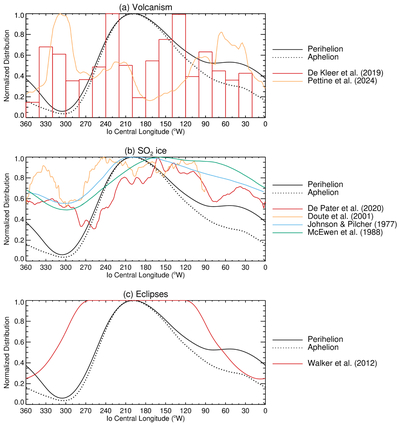
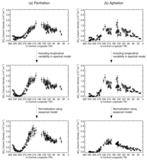
Caption: Figure 5.
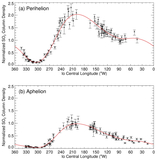
A comparison of the longitudinal distribution of equatorial SO2 column abundances with various other Io longitudinal datasets. All datasets have been normalized to a peak value of 1. (a) A comparison with two datasets showing the distribution of Io’s volcanic hotspots. (b) A comparison with four datasets showing the distribution of SO2 surface ice. (c) A comparison with a model that takes into account both eclipses and surface frost variability, with the eclipse effect dominating. See the text for details.
Other Images in This Article
Copyright and Terms & Conditions
© 2026. The Author(s). Published by the American Astronomical Society.

Copyright ©
2026 Astronomy Image Explorer. All Rights Reserved.
