

Image Details
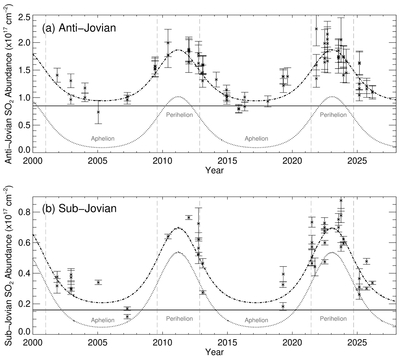
Caption: Figure 3.
The seasonal trends in the anti-Jovian and sub-Jovian equatorial SO2 column abundances. The anti-Jovian data cover longitudes of 120∘W–240∘W and are normalized to 180∘W. The sub-Jovian data cover longitudes of 300∘W–60∘W and are normalized to 360∘W. For each hemisphere, the dashed–dotted curve shows the best-fit seasonal model, combining the SO2 frost vapor-pressure equilibrium curve (dotted curve) and the constant, presumed volcanic, component (solid horizontal line).
Other Images in This Article
Copyright and Terms & Conditions
© 2026. The Author(s). Published by the American Astronomical Society.

Copyright ©
2026 Astronomy Image Explorer. All Rights Reserved.
