

Image Details
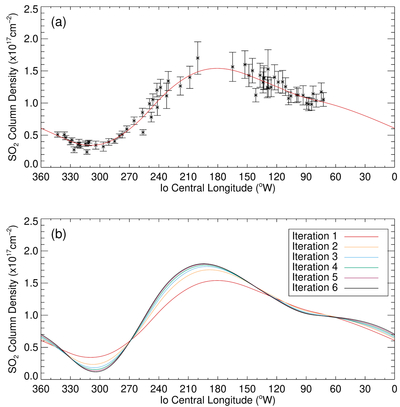
Caption: Figure 2.
(a) Equatorial SO2 column density as a function of central longitude for the 63 independent observations described in Section 2.3.2. These values were retrieved using the former version of the forward model, which did not take into account any longitudinal variability across the disk. The red line shows a fit to the data using a cubic spline, and this fitted curve was the longitudinal distribution used in Iteration 1 of the model improvement. (b) The longitudinal distributions produced at each step of the iterative model improvement. The black line, showing the results of Iteration 6, is the longitudinal distribution used in the final version of the forward model.
Other Images in This Article
Copyright and Terms & Conditions
© 2026. The Author(s). Published by the American Astronomical Society.

