

Image Details
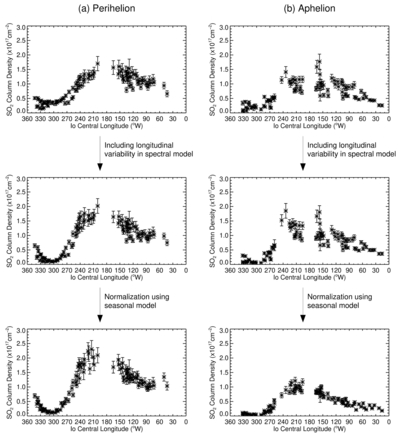
Caption: Figure A1.
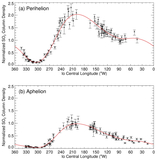
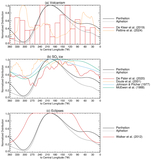
The steps taken to produce the final perihelion and aphelion longitudinal distributions of atmospheric density. Top panels: the perihelion and aphelion distributions using the initial spectral model. Middle panels: the perihelion and aphelion distributions using the updated spectral model. Bottom panels: the perihelion and aphelion distributions with the temporal normalization applied.
Other Images in This Article
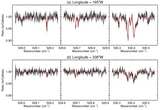
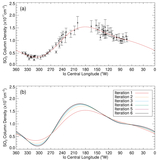
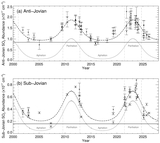
Copyright and Terms & Conditions
© 2026. The Author(s). Published by the American Astronomical Society.

Copyright ©
2026 Astronomy Image Explorer. All Rights Reserved.
