

Image Details
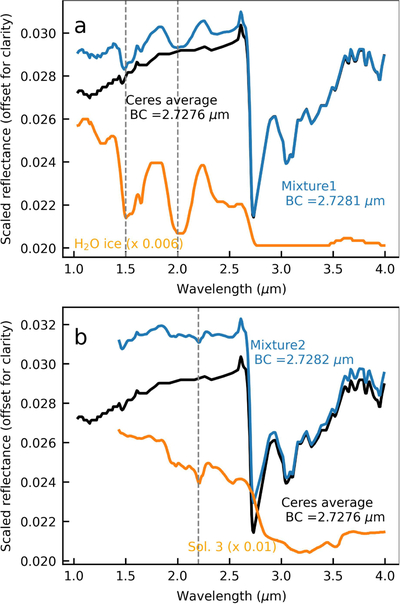
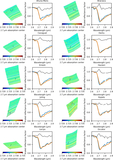
Caption: Figure B1.
Sensitivity analysis of the 2.7 µm band center to minor amounts of H2O ice and salts. In each panel, the black spectrum is the Ceres average spectrum from J.-P. Combe et al. (2016); the orange spectrum corresponds to (a) the H2O ice spectrum from J.-P. Combe et al. (2016) and (b) the brine spectrum (Sol. 3) from E. C. Thomas et al. (2019); the blue spectrum represents a mixture of the Ceres average with (a) H2O ice or (b) salts. The band centers of the Ceres average and the mixtures are noted. The vertical dashed lines illustrate the diagnostic features of H2O ice and salts.
Other Images in This Article
Show More
Copyright and Terms & Conditions
© 2026. The Author(s). Published by the American Astronomical Society.

Copyright ©
2026 Astronomy Image Explorer. All Rights Reserved.
