

Image Details
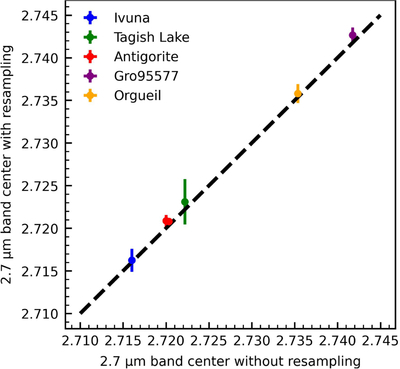
Caption: Figure A1.
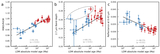
The influence of VIR spectral sampling on the 2.7 µm band center. The x-axis is the fitted 2.7 µm band center with the original laboratory measured spectra and the y-axis represents the band center fitted from the spectra with the VIR spectral sampling. The dashed line is the 1:1 line. The error bars are the uncertainty determined with the different SNR values ranging from 100 to 130.
Other Images in This Article
Show More
Copyright and Terms & Conditions
© 2026. The Author(s). Published by the American Astronomical Society.

Copyright ©
2026 Astronomy Image Explorer. All Rights Reserved.
