

Image Details
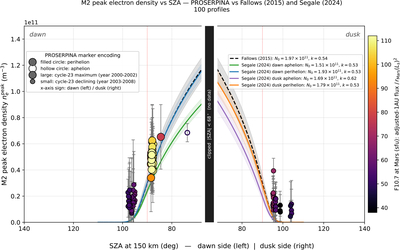
Caption: Figure 7.
M2 peak electron density ﹩{n}_{e}^{{\rm{peak}}}﹩ as a function of solar zenith angle (SZA), evaluated at the tangent point nearest z = 150 km altitude, for the 100 processed PROSERPINA profiles, compared with the fits of K. Fallows et al. (2015; black dashed: N0 = 1.97 × 10¹¹ m−3, k = 0.54, fitted to MGS data) and J. Segale et al. (2024), fitted to MAVEN ROSE data, for dawn aphelion (green solid: N0 = 1.51 × 10¹¹ m−3, k = 0.53), dawn perihelion (blue solid: N0 = 1.93 × 10¹¹ m−3, k = 0.53), dusk aphelion (purple solid: N0 = 1.69 × 10¹¹ m−3, k = 0.62), and dusk perihelion (orange solid: N0 = 1.79 × 10¹¹ m−3, k = 0.53). All reference fits use the form ﹩{n}_{e}^{{\rm{peak}}}(\chi )={N}_{0}\,{\rm{Ch}}{(\chi )}^{-k}﹩ with Ch the Smith & Smith Chapman function evaluated at z = 135 km and H = LM2 = 5.2 km; shaded bands are the envelope spanned by the ±1σ published fit-parameter uncertainties. The horizontal axis is split by LST sector: dawn profiles (LST < 12 h) on the left (negative) branch and dusk profiles (LST ≥12 h) on the right (positive) branch, with tick labels giving the physical ∣SZA∣ on each side; the Fallows fit is mirrored onto both branches, while the Segale dawn and dusk fits are drawn on their respective branches. The empty central region, where no profile was sampled, is clipped and shown as the dark vertical strip. PROSERPINA points carry a threefold encoding—season: hollow circles = aphelion, filled = perihelion; marker size for solar cycle phase—large = solar maximum (2002), small = declining phase (2003, 2005); marker color for the 10.7 cm solar radio flux scaled to Mars’ heliocentric distance, ﹩{F}_{10.7}^{{\rm{Mars}}}={F}_{10.7}^{{\rm{adj}},\,1\,{\rm{AU}}}/{r}_{{\rm{Mars}}}{({L}_{s})}^{2}﹩, i.e., the adjusted (1 AU) daily flux (LASP Interactive Solar Irradiance Datacenter (LISIRD) 2024) reprojected to the Mars–Sun distance at each observation. Error bars are σtotal at the M2 peak altitude. The red dotted vertical lines mark the terminator at SZA = 90∘ on each branch.
Other Images in This Article
Copyright and Terms & Conditions
© 2026. The Author(s). Published by the American Astronomical Society.

