

Image Details
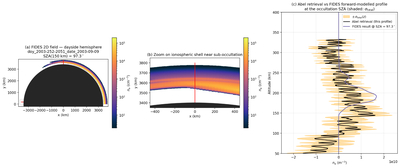
Caption: Figure 4.
FIDES applied to 1 of the 20 newly processed PROSERPINA profiles, occultation MGS32522051X65 on 2003-09-09 (SZA at ≃ 150 km altitude ≈97.∘3, a near-terminator geometry where the spherical-symmetry bias is expected to be largest). (a) The 2D Chapman + injection-bubble electron density field ne(x, y) in cm−3 (log color scale) that FIDES builds from the M1, M2, and any transient peaks detected in the Abel retrieval; the dayside hemisphere of Mars is shown in black, and the occultation line (the locus of points at the occultation SZA, θsub−occ = 90∘ in this convention) is the red line. (b) Zoom of panel (a) on the ionospheric shell within ± 450 km of the suboccultation column, showing the M2 layer band centered near 3550 km radial distance (∼150 km altitude); the red line is again the occultation line. (c) Vertical electron density profile at the occultation SZA. The black line is the Abel-inverted profile from the real radio occultation; the orange shaded band is the per-altitude total uncertainty ﹩{\sigma }_{{\rm{total}}}(z)=\sqrt{{\sigma }_{{\rm{ne}},{\rm{thermal}}}^{2}+{\sigma }_{{\rm{ne}},{\rm{slope}}}^{2}(z)+{\sigma }_{{\rm{ne}},{\rm{FIDES}}}^{2}(z)}﹩ around the Abel mean; the purple line is the FIDES forward-modeled vertical cut through the 2D field of panels (a)–(b), evaluated at the same SZA = 97.∘3. Because PROSERPINA’s Bayesian step updates only the uncertainty, not the mean, the Abel curve and shaded band are the actual quantities reported for this profile. Throughout this paper, the SZA reported for an occultation refers to the SZA of the tangent point at the 150 km altitude. FIDES builds on the approach of M. M. J. Crismani et al. (2019), implemented in Python and integrated into PROSERPINA.
Other Images in This Article
Copyright and Terms & Conditions
© 2026. The Author(s). Published by the American Astronomical Society.

