

Image Details
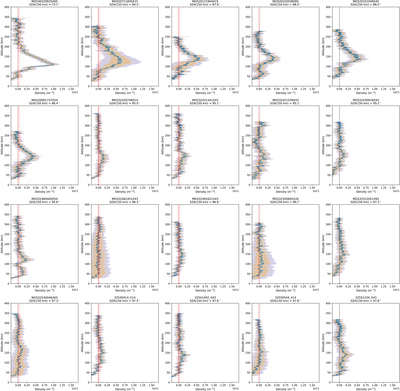
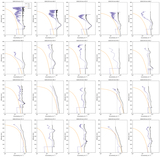
Caption: Figure 6.
We show 20 unprocessed and newly processed electron density profiles from MGS in blue (Density [m−3] vs. Altitude [km]), with the statistical uncertainty (σtotal(z)) shown in orange shade, and the 0.95 Bayesian credible interval (≃1.96σ) shown in periwinkle shade. The “best” profile was selected by eye from the family of candidates generated by iterating over multiple baseline configurations; the selection will be weighted and automated in the future. The SZA reported for each occultation corresponds to the tangent point at the ≃ 150 km altitude. The profiles are ordered in increasing SZA. Each panel title also includes the MGS file identifier of the occultation, so that each profile can be uniquely identified and reused in downstream studies.
Other Images in This Article
Copyright and Terms & Conditions
© 2026. The Author(s). Published by the American Astronomical Society.

