

Image Details
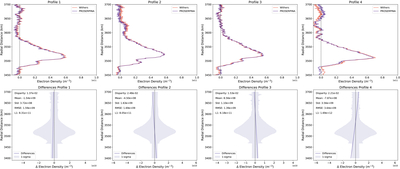
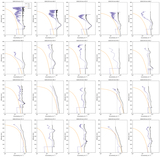
Caption: Figure 5.
(Top) Validation profiles (orange) and PROSERPINA retrieved profiles (purple), with the values of the disparity at the bottom of each pair of profiles derived from the same occultations. (Bottom) Pointwise difference between each pair of profiles at every altitude is shown as a solid line, with the PROSERPINA estimated uncertainty on the electron density profile represented as a shaded area. Each panel reports the disparity, Mean Difference, Standard Deviation, Root Mean Square Error, and L1 distance for each pair of profiles. The “disparity” quoted in each panel is the statistic returned by the Procrustes analysis: the residual sum of squared differences between the two profiles after they have been optimally translated, rotated, and scaled onto one another, normalized so that 0 denotes identical shapes and larger values denote profiles that require more reshaping to be brought into correspondence.
Other Images in This Article
Copyright and Terms & Conditions
© 2026. The Author(s). Published by the American Astronomical Society.

