

Image Details
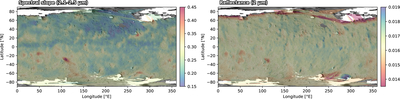
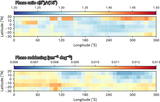
Caption: Figure 8.
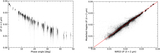
Map of the (left) spectral slope computed from 2.1 and 2.5 μm in μm−1; (right) reflectance at 2 μm. The two maps were created using photometrically corrected reflectance data, obtained on 2018 July 11 and July 19. The footprints were rasterized into a 0﹩\mathop{.}\limits^{{\unicode{x000b0}}}﹩1 × 0﹩\mathop{.}\limits^{{\unicode{x000b0}}}﹩1 latitude and longitude grid, and the median value was computed for each grid element.
Other Images in This Article
Show More
Copyright and Terms & Conditions
© 2026. The Author(s). Published by the American Astronomical Society.

Copyright ©
2026 Astronomy Image Explorer. All Rights Reserved.
