

Image Details
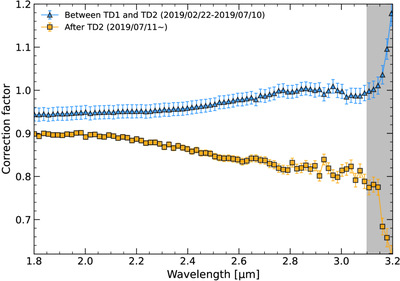
Caption: Figure A1.
Relative correction factor as a function of the wavelength between 1.8 μm and 3.2 μm. The correction factor is computed so that data obtained after TD1 can be matched with the reflectance level of the data before TD1, which contains original and not altered calibration. The gray area corresponds to the wavelength region where the spectra exhibit calibration and/or thermal tail removal residuals.
Other Images in This Article
Show More
Copyright and Terms & Conditions
© 2026. The Author(s). Published by the American Astronomical Society.

Copyright ©
2026 Astronomy Image Explorer. All Rights Reserved.
