

Image Details
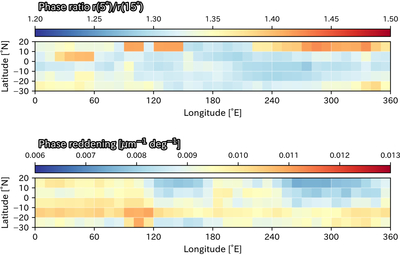
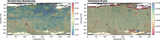
Caption: Figure 9.
Map of the (top) phase ratio I(5°)/I(15°) at 2.0 μm and (bottom) phase reddening (with spectral slope computed between 2.1 μm and 2.5 μm). The maps were computed using a 10° × 10° grid at the Ryugu surface. The particularly high phase ratio and low phase reddening values for some grid elements located at latitudes above 10°N are due to a narrower phase angle range (see Appendix F, Figure F3). All grid elements above this latitude were discarded for the computation of the average east and west properties.
Other Images in This Article
Show More
Copyright and Terms & Conditions
© 2026. The Author(s). Published by the American Astronomical Society.

Copyright ©
2026 Astronomy Image Explorer. All Rights Reserved.
