

Image Details
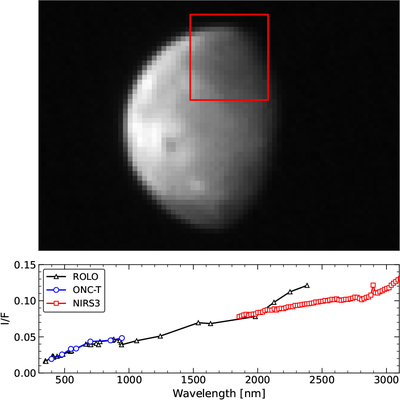
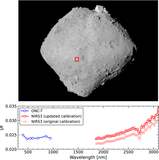
Caption: Figure 5.
(Top) ONC-T image of the Moon acquired in the ul filter on 2015 December 05T11:50:43.00 during the Earth swing-by, along with the NIRS3 footprint (red square) on 2015 December 05T11:50:38.00. The image is cropped to highlight the position of the NIRS3 footprint. (Bottom) ONC-T radiance factor spectrum (blue circles) integrated from pixels inside the NIRS3 footprint, and NIRS3 radiance factor spectrum after applying calibration factors obtained in this work (red squares). The ROLO spectrum at the geometry of the Hayabusa2 instrument observations is also shown (black triangle).
Other Images in This Article
Show More
Copyright and Terms & Conditions
© 2026. The Author(s). Published by the American Astronomical Society.

Copyright ©
2026 Astronomy Image Explorer. All Rights Reserved.
