

Image Details
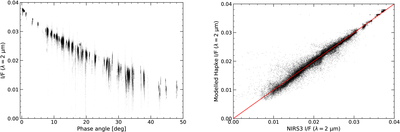
Caption: Figure 6.
(Left) Ryugu phase curve from NIRS3 data acquired during the proximity phase at 2 μm. (Right) Modeled versus NIRS3 radiance factor values at 2 μm. The red solid line represents the y = x straight line.
Other Images in This Article
Show More
Copyright and Terms & Conditions
© 2026. The Author(s). Published by the American Astronomical Society.

Copyright ©
2026 Astronomy Image Explorer. All Rights Reserved.
