

Image Details
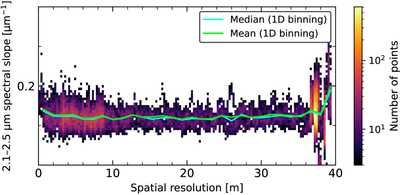
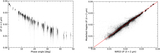
Caption: Figure I1.
Spectral slope (2.1–2.5 μm) distribution as a function of the NIRS3 spatial resolution [meters]. Data are restricted to similar geometric conditions (20° < α < 30°, i < 50°, e < 50°). The data were binned in a 2D slope–resolution grid using 150 × 150 bins. The color bar corresponds to the number of points per bin. We considered only bins containing at least three points; others are considered empty. The cyan and lime solid lines represent the median and mean values from each resolution bin, respectively.
Other Images in This Article
Show More
Copyright and Terms & Conditions
© 2026. The Author(s). Published by the American Astronomical Society.

Copyright ©
2026 Astronomy Image Explorer. All Rights Reserved.
