

Image Details
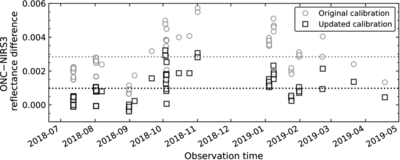
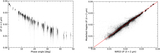
Caption: Figure E1.
Comparison between ONC-T and NIRS3 reflectance levels for an image/spectrum acquired at a similar time (±2 s), and for the same region of the Ryugu surface. The reflectance level is computed from the average of the reflectance at x (0.86 μm) and p (0.95 μm) filters for ONC-T, and from the average of the first five effective wavelength channels of NIRS3. The dotted lines represent the mean reflectance differences for the NIRS3 original calibration (in gray) and for the NIRS3 updated calibration proposed in this work (in black).
Other Images in This Article
Show More
Copyright and Terms & Conditions
© 2026. The Author(s). Published by the American Astronomical Society.

Copyright ©
2026 Astronomy Image Explorer. All Rights Reserved.
