

Image Details
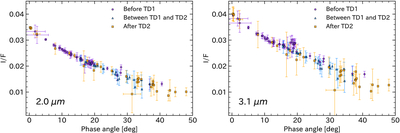
Caption: Figure A2.
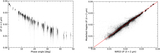
Ryugu phase curves from NIRS3 data before TD1 (purple circles), between TD1 and TD2 (blue triangles), and after TD2 (orange squares) after applying the results of our updated calibration; (left) at 2 μm (right) at 3.1 μm.
Other Images in This Article
Show More
Copyright and Terms & Conditions
© 2026. The Author(s). Published by the American Astronomical Society.

Copyright ©
2026 Astronomy Image Explorer. All Rights Reserved.
