

Image Details
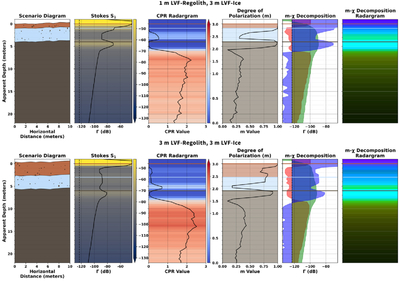
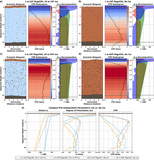
Caption: Figure 9.
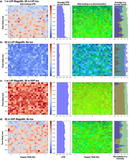
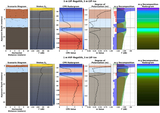
(Top) Case 5: 1 m LVF regolith, 3 m LVF ice. (Bottom) Case 9: 3 m LVF regolith, 3 m LVF ice. From left to right: diagram of scenario showing subsurface profile. Stokes S1 radargram displaying total return power in dB, with range-averaged response overlaid as a black line. CPR radargram, with range-averaged response overlaid as a black line. Degree of polarization (m) plotted against apparent depth, with background shading denoting regolith, ice, and basalt units. The m-χ decomposition plotted against apparent depth. The m-χ decomposition radargram. Dashed vertical lines in S1 and m-χ plots at −123 dB indicate the NE-Γ noise floor (SNR = 0 dB). Orange, blue, and brown horizontal lines denote interfaces of regolith, ice, and basalt, respectively.
Other Images in This Article
Show More
Copyright and Terms & Conditions
© 2026. The Author(s). Published by the American Astronomical Society.

