

Image Details
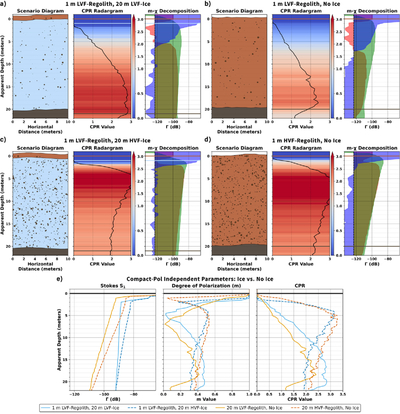
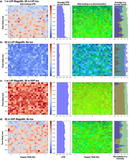
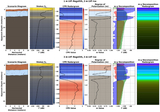
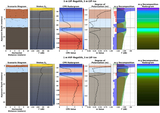
Caption: Figure 6.
Model outputs of thick ice (a), (c) and no ice (b), (d) end-member cases. Panels (a), (b) display LVF inclusions and (c), (d) display HVF inclusions. From left to right: diagram of scenario showing subsurface layering, scatterer volume fraction, and surface/interface parameters. CPR radargram of scene plotted against apparent depth, with range-averaged CPR overlaid as a black line. The m-χ decomposition of the scene plotted against apparent depth. The m-χ decomposition shows red, green, and blue colors overlaid on one another. Orange, blue, and brown horizontal lines on plots indicate location of regolith, ice, and basalt interfaces for clarity. Dashed vertical line in m-χ plot at −123 dB indicates the NE-Γ noise floor (SNR = 0 dB). Panel (e) overlays the Stokes S1, m, and CPR responses for end-member cases to compare separability between ice-bearing and ice-free environments.
Other Images in This Article
Show More
Copyright and Terms & Conditions
© 2026. The Author(s). Published by the American Astronomical Society.

