

Image Details
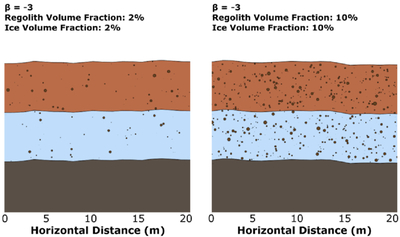
Caption: Figure 5.
Statistically accurate diagram representation of low-2% (left) and high-10% (right) volume fraction of scatterers, with diameters of 0.001–0.4 m, and ﹩\beta ﹩ of −3. These images illustrate the size, number density, and distribution of scatterers. This image is illustrative only and not indicative of any actual simulation, as inclusion locations are not deterministic.
Other Images in This Article
Show More
Copyright and Terms & Conditions
© 2026. The Author(s). Published by the American Astronomical Society.

Copyright ©
2026 Astronomy Image Explorer. All Rights Reserved.
