

Image Details
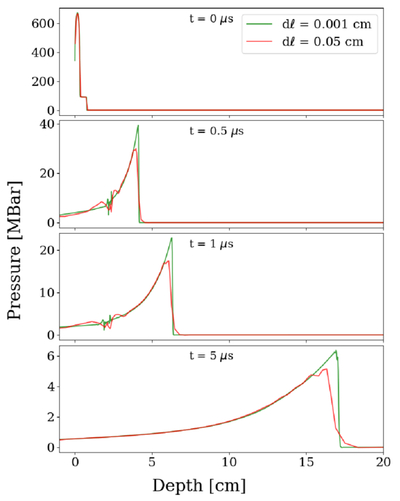
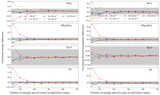
Caption: Figure E1.
The pressure wave induced by the energy deposition in Spheral 1D simulations at high (0.001 cm, green) and low (0.05 cm, red) resolution. Panels show times t = 0, 0.5, 1, and 5 μs from top to bottom. The high-resolution curve shows a larger peak pressure at slightly larger depths and a sharper profile overall compared to the low-resolution curve, at all times. Therefore, low-resolution simulations underpredict the strength of the shock propagation and may underestimate the damage caused specifically by the shock wave.
Other Images in This Article
Show More
Copyright and Terms & Conditions
© 2026. The Author(s). Published by the American Astronomical Society.

Copyright ©
2026 Astronomy Image Explorer. All Rights Reserved.
