

Image Details
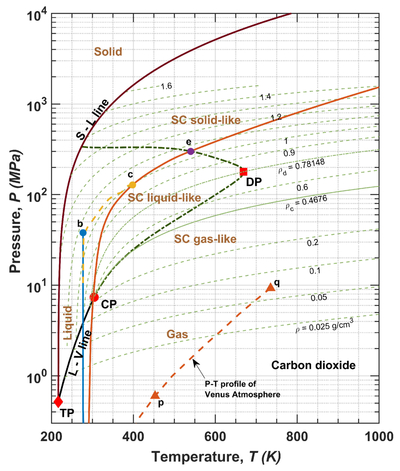
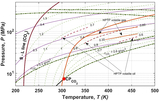
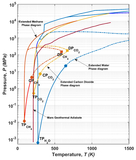
Caption: Figure 6.
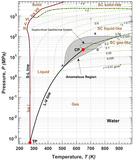
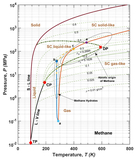
New phase diagram of carbon dioxide. The solid orange line represents the estimated D–P–T inside the Earth; the solid blue line is for the ocean, superimposed from Figure 2. Here, (i) “b” is the average depth of the ocean, ∼3.7 km, (ii) “c” is the meeting point of the ocean geotherm and crust, (iii) “e” is the point beyond which methane transitions to the SC solid-like state, and (iv) the dashed orange line represents the atmospheric conditions of Venus, while “q” is the surface point.
Other Images in This Article
Copyright and Terms & Conditions
© 2026. The Author(s). Published by the American Astronomical Society.

Copyright ©
2026 Astronomy Image Explorer. All Rights Reserved.
