

Image Details
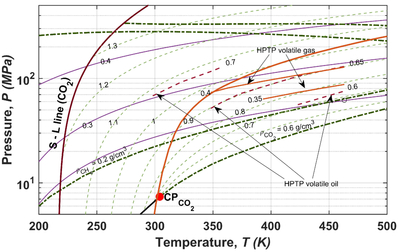
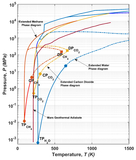
Caption: Figure 8.
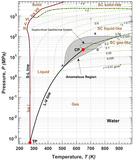
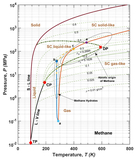
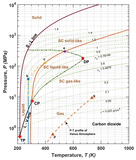
Pressure–temperature (P–T) map showing the extended phase diagram of CO2 and CH4 with isodensity contours (dashed green and violet lines, respectively). Superimposed are the representative P–T trajectories of high-pressure/high-temperature (HPHT) volatile gas and oil reservoirs (solid orange and dashed brown lines, respectively).
Other Images in This Article
Copyright and Terms & Conditions
© 2026. The Author(s). Published by the American Astronomical Society.

Copyright ©
2026 Astronomy Image Explorer. All Rights Reserved.
