

Image Details
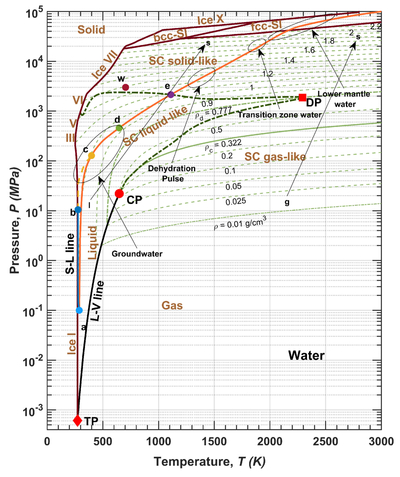
Caption: Figure 3.
New phase diagram of water with the boundaries of liquid/SC liquid-like state, SC liquid-like/gas-like state, SC liquid-like/solid-like state, and Dwij Point (DP), beyond which only two phases, solid and gas, exist (adapted from V. Prasad et al. 2025). The orange line represents the estimated D–P–T inside the Earth; the solid blue line is for the ocean, superimposed from Figure 2. The isotherms under the ocean and the continent meet at “c” (200 MPa, 473 K). Here, (i) “a” represents the ground surface, (ii) “b”, the average depth of the ocean, ∼3.7 km, (iii) “d”, the location beyond which the water will be in SC conditions (P > Pc and T > Tc), (iv) “e”, beyond which, at both higher pressures and higher temperatures, water will not exist in its SC liquid-like state (also, point ’W’) but transform into the SC solid-like state, (v) ellipses labeled groundwater, dehydration pulse, transition zone water, and lower mantle water denote representative P − T domains associated with these geological conditions, (vi) line ‘gs’, probable phase transition of subducting water from the surface to lower mantle, and (vii) line ‘gs’, hypothetical phase transition of subducting water if the temperature is beyond 2294 K.
Other Images in This Article
Copyright and Terms & Conditions
© 2026. The Author(s). Published by the American Astronomical Society.

