

Image Details
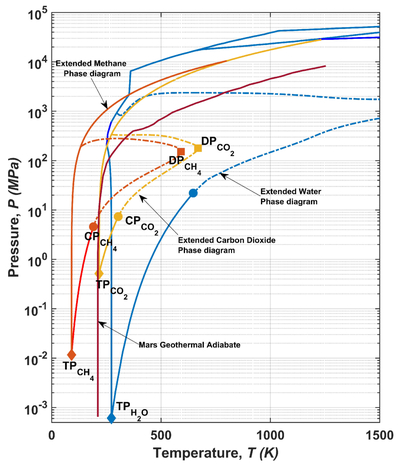
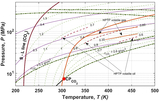
Caption: Figure 10.
Mars geothermal adiabat (brown) superimposed on phase diagrams of: water (blue), methane (orange), and carbon dioxide (yellow), based on Figures 3, 5, and 6. The solid, dashed, and dashed–dotted lines represent the L–V line, S–L line, and ζ2 = 0 loop, respectively. The triple point (TP), CP, and DP are represented by diamonds, circles, and squares, respectively.
Other Images in This Article
Copyright and Terms & Conditions
© 2026. The Author(s). Published by the American Astronomical Society.

Copyright ©
2026 Astronomy Image Explorer. All Rights Reserved.
