

Image Details
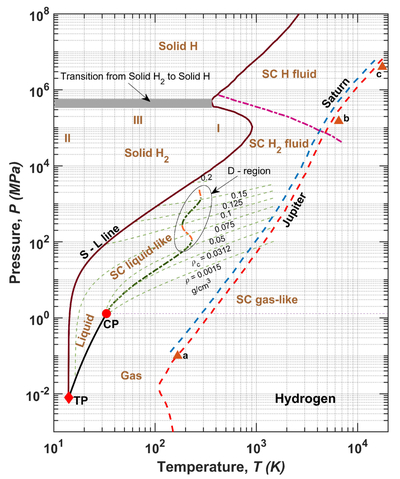
Caption: Figure 9.
New phase diagram of hydrogen showing the “D” region (the existence of the DP and SC solid-like states cannot be explicitly prescribed, since the behavior in the “D” region is not straightforward; more data is needed to close this gap). Pressure–temperature profiles of Jupiter and Saturn are indicated by the red and blue dashed lines, respectively. The solid–liquid boundary above 4 GPa and the transition from molecular solid H2 to atomic solid H are adopted from J. M. McMahon et al. (2012), while the magenta transition from molecular fluid H2 to atomic fluid H is based on R. Helled (2019).
Other Images in This Article
Copyright and Terms & Conditions
© 2026. The Author(s). Published by the American Astronomical Society.

Copyright ©
2026 Astronomy Image Explorer. All Rights Reserved.
