

Image Details
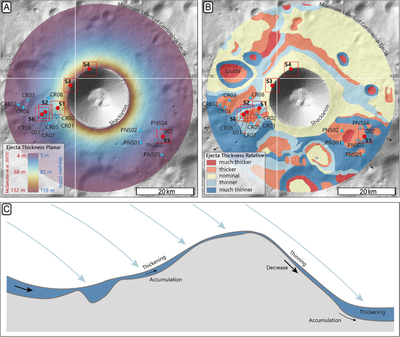
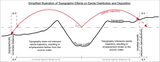
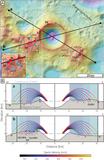
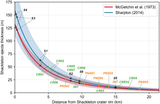
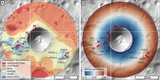
Caption: Figure 10.
(A) Estimated thickness of Shackleton ejecta on a planar surface (T. R. McGetchin et al. 1973; V. L. Sharpton 2014) on a 20 m pixel−1 hillshade map (M. K. Barker et al. 2023). (B) Schematic map qualitatively showing the variation in Shackleton ejecta thickness relative to that predicted by scaling relationships (A), highlighting the influence of regional elevation and slope. It is important to note that in regions with thinner ejecta, the extent of the continuous ejecta deposit is larger. (C) Schematic cross section illustrating the effects of topography on ejecta emplacement, with thickening at the base of steep slopes and thinning on massifs (inspired by a figure from T. Frueh & D. A. Kring 2026a).
Other Images in This Article
Copyright and Terms & Conditions
© 2026. The Author(s). Published by the American Astronomical Society.

