

Image Details
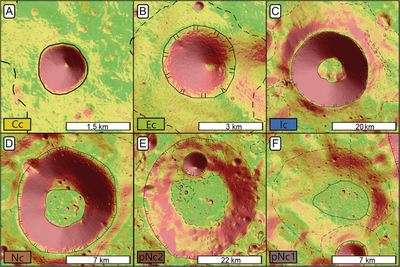
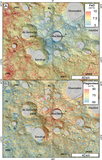
Caption: Figure 4.
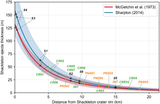
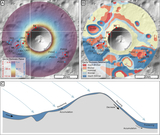
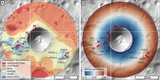
Examples of crater classes spanning the (a) Copernican, (b) Eratosthenian, (c) Imbrian, (d) Nectarian, and (e), (f) pre-Nectarian periods. The 10 m pixel−1 slope maps (M. K. Barker et al. 2023) are shown on a 10 m pixel−1 hillshade base map. Green colors indicate slopes of <5°, yellow symbolizes slopes of 5°–10°, orange shows slopes of 10°–15°, red indicates slopes of 15°–20°, and wine-red colors symbolize slopes >20°. Shackleton crater is shown in panel (c) and Faustini crater in panel (e).
Other Images in This Article
Copyright and Terms & Conditions
© 2026. The Author(s). Published by the American Astronomical Society.

Copyright ©
2026 Astronomy Image Explorer. All Rights Reserved.
