

Image Details
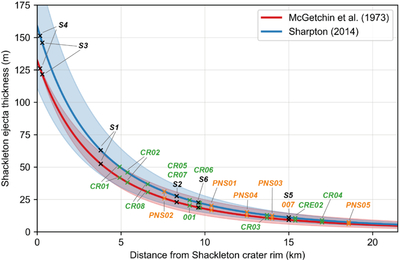
Caption: Figure 9.
Estimated Shackleton ejecta thickness as a function of distance from the crater based on scaling models of T. R. McGetchin et al. (1973) and V. L. Sharpton (2014). Shaded areas indicate the error range inherent to Equations (2) and (3). The error calculation for T. R. McGetchin et al. (1973) was later introduced by H. J. Melosh (1989). Black marks indicate the locations of the six CE-7 candidate landing sites (Deep Space Exploration Laboratory 2022), orange marks represent Artemis candidate landing sites in the “Peak Near Shackleton” region (L. Wueller et al. 2026a), and green marks indicate Artemis candidate landing sites in the “Connecting Ridge” region (L. Wueller et al. 2026a). Their respective thicknesses are included in Tables 1– 3 and are discussed in Section 6.
Other Images in This Article
Copyright and Terms & Conditions
© 2026. The Author(s). Published by the American Astronomical Society.

