

Image Details
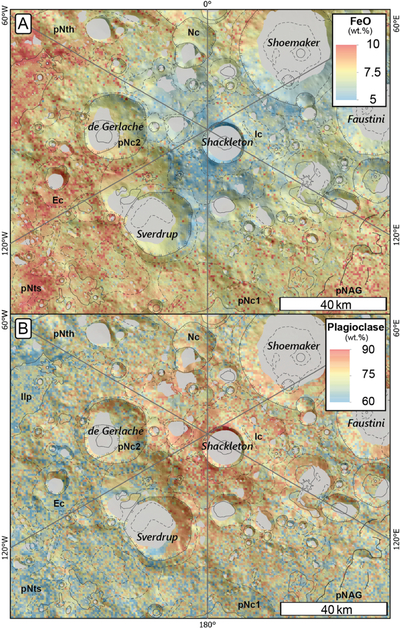
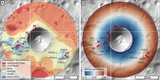
Caption: Figure 6.
Distribution of (A) FeO and (B) plagioclase based on 1 km pixel−1 spectral data with a 9 wt% uncertainty from M. Lemelin et al. (2022b) on a hillshade base map. Mapped unit boundaries and crater rims (Figure 3) are included to show the characteristics of the mapped units. Spectral data are unavailable in PSRs (M. K. Barker et al. 2023, gray areas).
Other Images in This Article
Copyright and Terms & Conditions
© 2026. The Author(s). Published by the American Astronomical Society.

Copyright ©
2026 Astronomy Image Explorer. All Rights Reserved.
