

Image Details
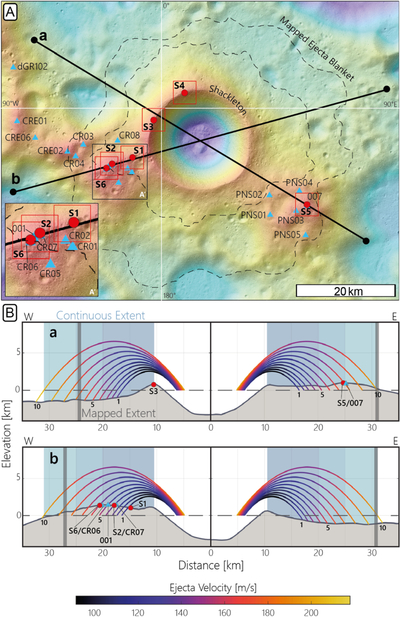
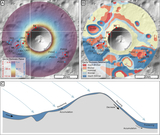
Caption: Figure 8.
(A) Topographic map of Shackleton crater (20 m pixel−1; M. K. Barker et al. 2023) with the mapped ejecta deposit (Figure 3) and locations of potential landing sites for the CE-7 mission (red circles; Deep Space Exploration Laboratory 2022) and the Artemis campaign (blue triangles; L. Wueller et al. 2026a). (B) Ejecta trajectories for a 45° ejection angle and launch positions moving toward the transient crater rim. The shaded blue areas represent the shortest (lighter hue), nominal, and maximum (darker hue) continuous ejecta deposits (H. J. Moore et al. 1974). Trajectories are colored by ejecta velocity and numbered from 1 to 10 with distance from the crater rim. Vertical gray lines indicate the morphologically mapped ejecta extent (2.5× vertical exaggeration).
Other Images in This Article
Copyright and Terms & Conditions
© 2026. The Author(s). Published by the American Astronomical Society.

