

Image Details
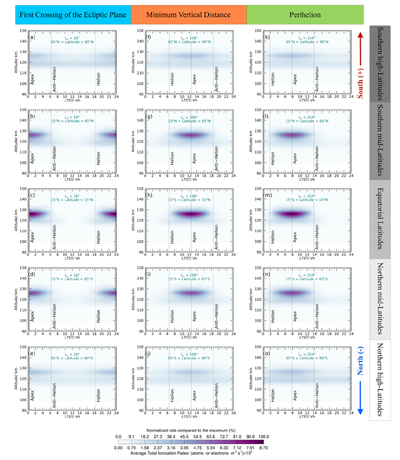
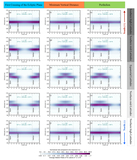
Caption: Figure 13.
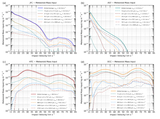
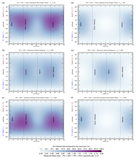
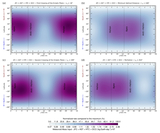
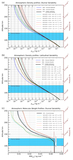
Average diurnal variability of the total ionization rates, in atoms (or electrons) m−3 s−1, estimated by the CABMOD–MIF model at southern high latitudes (65° < ﹩\phi ﹩ < 90°; panels (a), (f), and (k)), southern mid-latitudes (15° < ﹩\phi ﹩ < 65°; panels (b), (g), and (l)), equatorial latitudes (−15° < ﹩\phi ﹩ < 15°; panels (c), (h), and (m)), northern mid-latitudes (−15° < ﹩\phi ﹩ < −65°; panels (d), (i), and (n)), and northern high latitudes (−65° < ﹩\phi ﹩ < −90°; panels (e), (j), and (o)). The left panels represent the first crossing of the ecliptic plane (LS = 18°), middle column panels show the results for the minimum vertical distance (LS = 108°), and right panels show the average rates at perihelion (LS = 254°). An animation of the total ionization rates as a function of the altitude at the equator (panels (c), (h), (m), and (r)) is available; the animation cycles through all solar longitudes, starting from aphelion LS = 73°, going to LS = 0°, and then to LS = 73°.
(An animation of this figure is available in the online article.)
(An animation of this figure is available.)
The video/animation of this figure is available in the online journal.
Other Images in This Article
Show More
Copyright and Terms & Conditions
© 2026. The Author(s). Published by the American Astronomical Society.

