Image Details
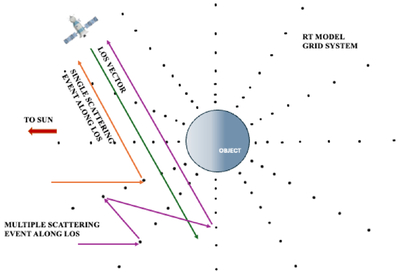
Caption: Figure 6.
Schematic illustrating the treatment of single and multiple scattering in the 3D model’s geometry. The black dots represent different altitudes and solar zenith angles within the 3D model’s grid system.
Other Images in This Article
Show More
Copyright and Terms & Conditions
© 2026. The Author(s). Published by the American Astronomical Society.
Copyright ©
2026 Astronomy Image Explorer. All Rights Reserved.