Image Details
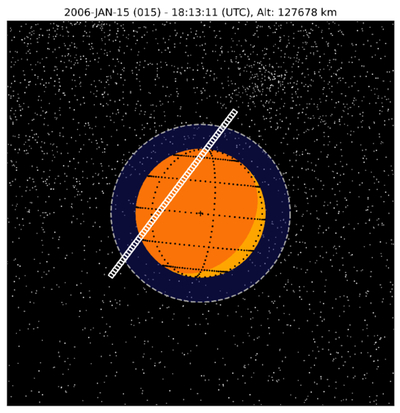
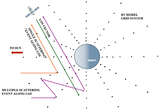
Caption: Figure 1.
Geometry of a UVIS scan during the T10 flyby (2006 January 15). The dark-orange region represents Titan’s nightside, while the light-orange region represents Titan’s dayside. The blue shaded area illustrates the region of Titan’s atmosphere below 1000 km altitude. Each white box corresponds to a spatial pixel on the UVIS detector. The white dots represent background stars. The top caption includes the date and time of the observation, as well as Cassini’s altitude.
Other Images in This Article
Show More
Copyright and Terms & Conditions
© 2026. The Author(s). Published by the American Astronomical Society.
Copyright ©
2026 Astronomy Image Explorer. All Rights Reserved.